MISE À JOUR MENSUELLE SUR LES CONTRÔLES PAR L'ÉTAT DU PORT EN JUILLET 2025

Aperçu
En juillet 2025, 6 526 inspections PSC et 163 détentions (2,50 %) ont été enregistrées à l'échelle mondiale, le MOU de Tokyo représentant la majeure partie du volume (3 847 inspections) avec un taux de détention inférieur à la moyenne de 2,34 %, tandis que le MOU de la mer Noire restait l'exception avec 8,99 % et 4,5 défaillances par inspection (la seule interdiction a eu lieu dans le cadre du Mémorandum d'entente de Paris). Par rapport à juin 2025, les immobilisations ont diminué aux MOU de Paris, de l'océan Indien et de Méditerranée, mais ont augmenté au MOU Tokyo et surtout au MOU de la mer Noire ; Le MOU Abuja a connu une légère hausse, tandis que celui des Caraïbes est resté calme.
(Source : MarineTraffic - 14 août 2025)
Key takeaways
- Tokyo and Paris MOUs account for ~79% of inspections but only ~63% of detentions, whereas the Black Sea contributes just ~5% of inspections yet nearly 20% of detentions.
- The deficiency mix shifted toward certification (Asset Certificates up in volume and share) and Ballast Water.
- Shanghai Ocean Shipping, Anglo Eastern Shipmanagement Singapore, and Fleet Ship Management kept <1 deficiency per inspection.
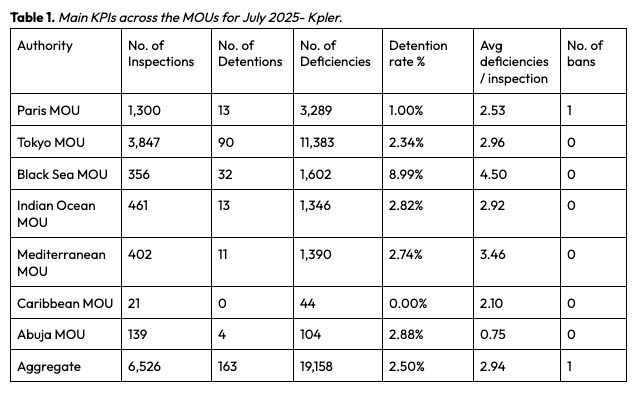
Headline KPIs
In July 2025, PSC activity totaled 6,526 inspections, 163 detentions (global 2.50%), and 19,158 deficiencies, an average of 2.94 deficiencies per inspection, with one ban issued in the Paris MOU. Tokyo MOU carried the workload (3,847 inspections; 90 detentions; 2.34% rate), while Paris paired substantial volume (1,300 inspections) with the lowest major-hub detention rate (1.00%) yet accounted for the month’s only ban. Risk remained concentrated in the Black Sea MOU (356 inspections, 32 detentions; 8.99% and 4.50 deficiencies/inspection), whereas Indian Ocean (2.82%), Mediterranean (2.74%), and Abuja (2.88% with 0.75 deficiencies/inspection) sat near the global average; the Caribbean saw 21 inspections with 0% detentions.
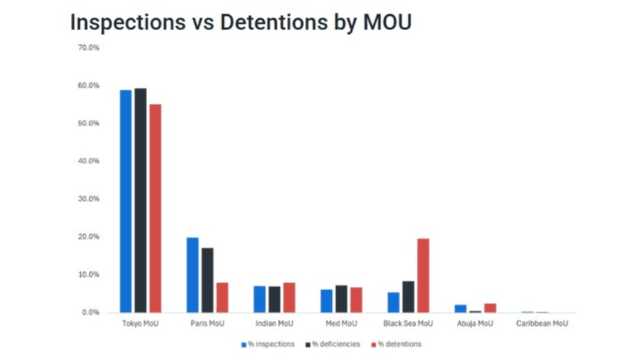
Inspections vs Detentions by MOU
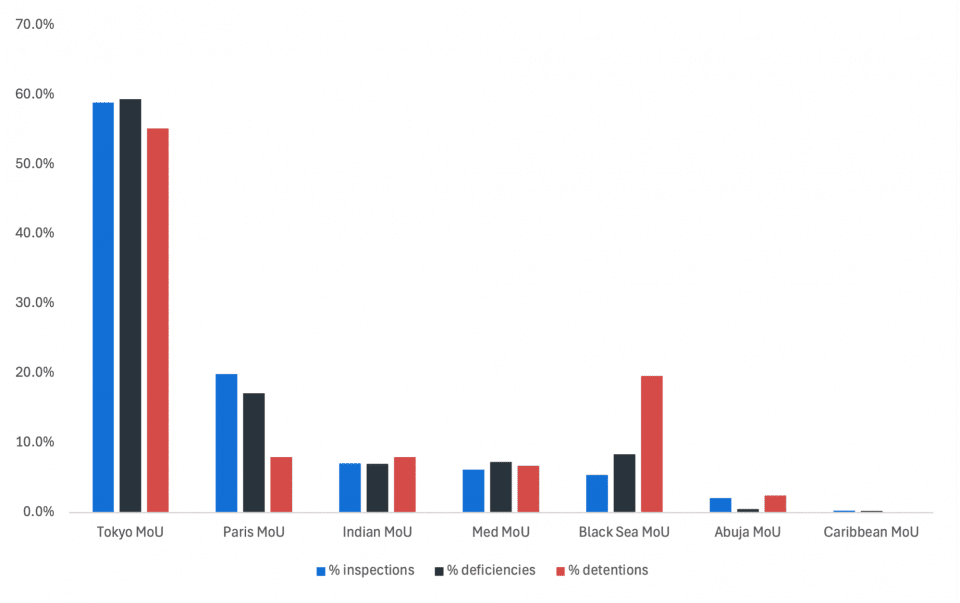 Graph 1. Distribution of Inspections, Deficiencies, and Detentions by MOU (% of all events across all PSCs, July 2025) - Kpler.
Tokyo and Paris MOUs together account for roughly 79% of all inspections but only about 63% of detentions, suggesting comparatively lower enforcement intensity in those regions. In contrast, the Black Sea MOU represents just 5% of inspections yet nearly 20% of detentions, highlighting it as a challenging hotspot where vessels face disproportionate detention likelihood. Other regions (Indian, Mediterranean, Abuja, Caribbean) show more balanced inspection-to-detention ratios, indicating enforcement levels more in line with their inspection volumes.
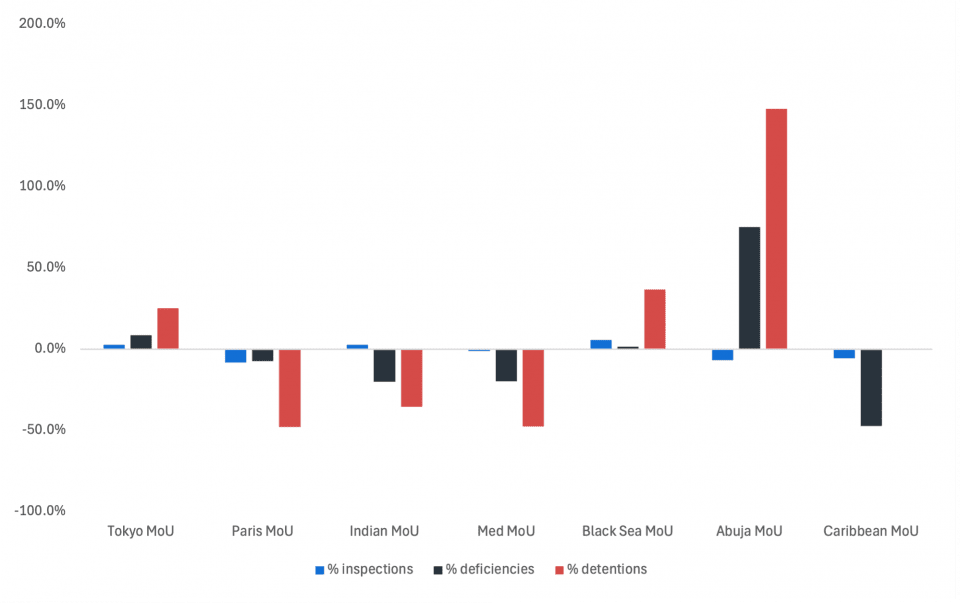 Graph 2. MoM Changes for July 2025 vs. June 2025 on Distribution of Inspections, Deficiencies, and Detentions by MOU (% of Aggregate) - Kpler.
Comparing July 2025 with June 2025, the picture is uneven across MOUs. Tokyo saw a small rise in inspections but a larger uptick in detentions, pointing to slightly tougher outcomes month-on-month. Paris moved in the opposite direction with fewer inspections and a sharp fall in detentions, easing near-term risk. The Black Sea tightened further, minor increases in inspections/deficiencies but a notable jump in detentions, keeping it the key hotspot. Indian Ocean and Mediterranean were steadier, with relatively flat inspections and clear drops in detentions, suggesting softer enforcement or better readiness. Abuja stands out: despite fewer inspections, deficiencies surged and detentions more than doubled from a small base, flagging concentrated risk. Caribbean activity slipped and remained quiet with no detentions.
Detention-rate trend
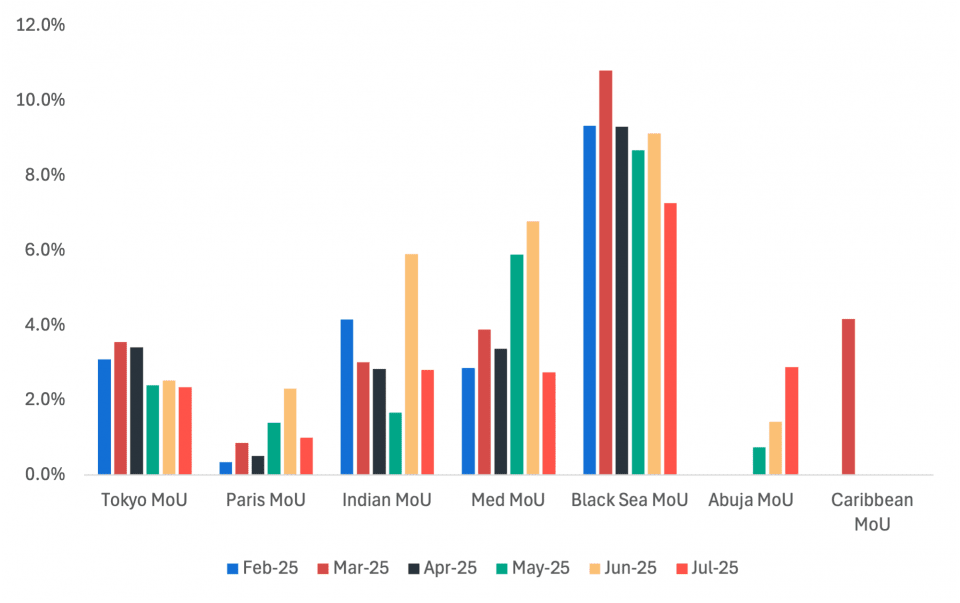 Graph 3. 6-Month Detention Rate Trends - Kpler.
Over the last six months, detention risk has eased in the big hubs while staying elevated at the Black Sea. Tokyo has trended down from ~3.5% in March to ~2.4% in July. Paris spiked in June but retraced to ~1.0% in July. The Indian Ocean and Mediterranean both saw June flare-ups (≈5–7%) that normalized in July (≈2.8% and ≈2.7% respectively). The Black Sea remains the outlier, peaking around March (~11%) and easing through July, still highest among MOUs. Abuja shows a steady climb (≈0.7% in May to ~2.9% in July), while the Caribbean registered a one-off March blip (~4%) with little activity since. Overall, July marks a broad softening from June’s peaks, but the Black Sea and Abuja warrant continued attention.
Deficiencies profile
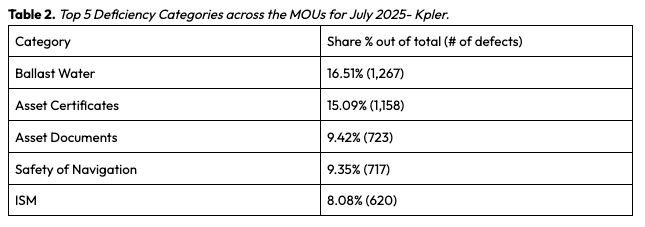 The top five deficiency categories were unchanged from June, but the mix shifted. Ballast Water fell in count (from 1,395 to 1,267) while its share ticked up slightly (from 16.35% to 16.51%). Asset Certificates was the only category to rise in volume (from 1,058 to 1,158), lifting its share notably (from 12.40% to 15.09%) and narrowing the gap with Ballast Water. Asset Documents and Safety of Navigation both declined in volume and share (from 873 to 723; from 10.23% to 9.42% and from 853 to 717; from 10.00% to 9.35%). ISM eased in count (from 665 to 620) but edged up in share (from 7.79% to 8.08%).
PSC hotspots
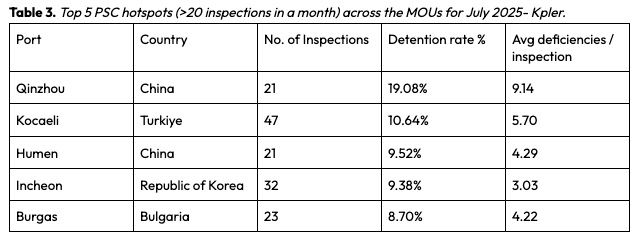 Qinzhou was the riskiest: the detention rate climbed to 19.1% (from 14.3%) even as findings per inspection eased to 9.14 (from 13.24). Kocaeli, the busiest with 47 inspections, improved on both fronts, with detentions down to 10.6% (from 17.4%) and deficiencies to 5.7 (from 8.8). Humen deteriorated across the board (9.5% vs 4.8% detentions; 4.29 vs 3.14 deficiencies). Incheon and Burgas posted higher detention rates (9.4% and 8.7%, up from 6.7% and 5.0%), but slightly cleaner inspections (3.03 vs 4.8; 4.22 vs 4.9).
ISM Managers performance
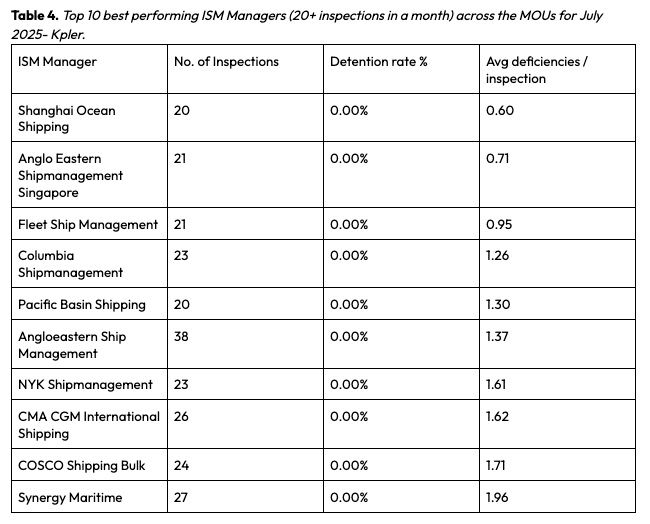
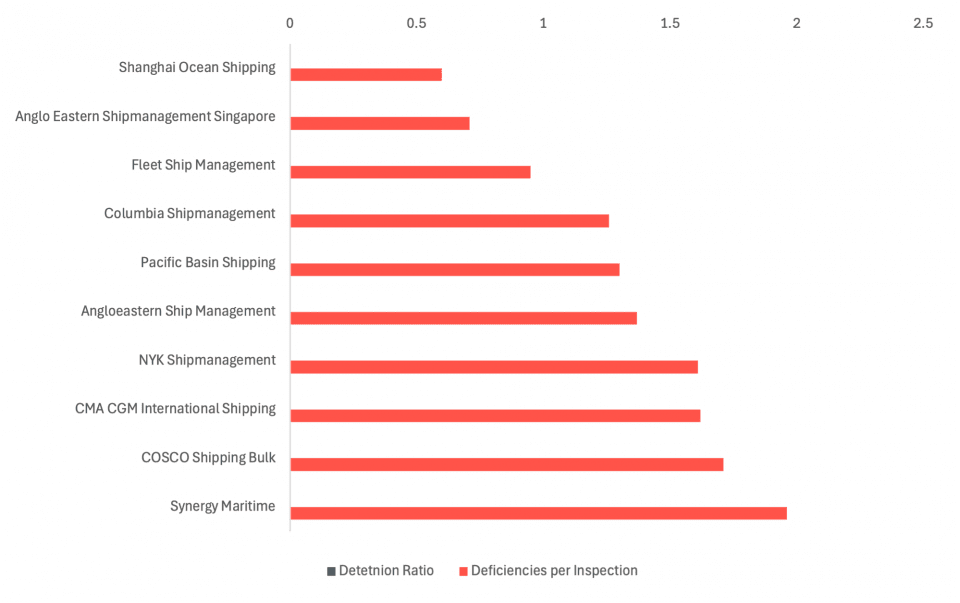 Graph 4. Top 10 best ISM Managers’ performance (20+ inspections in a month) across the MOUs for July 2025- Kpler.
The best results came from Shanghai Ocean Shipping (0.60), Anglo Eastern Shipmanagement Singapore (0.71), and Fleet Ship Management (0.95), setting a sub-1.0 benchmark. Columbia Shipmanagement (1.26) and Pacific Basin Shipping (1.30) followed closely, while Angloeastern Ship Management paired the largest sample size (38 inspections) with a solid 1.37 average, strong consistency at scale. NYK (1.61), CMA CGM International Shipping (1.62), COSCO Shipping Bulk (1.71), and Synergy Maritime (1.96) also kept clean detention records but with higher findings.
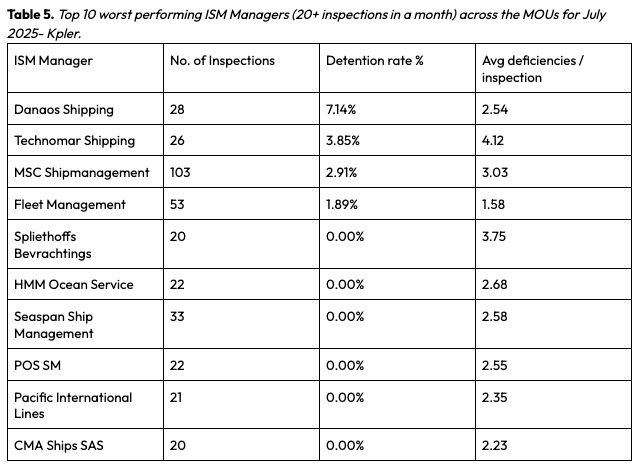
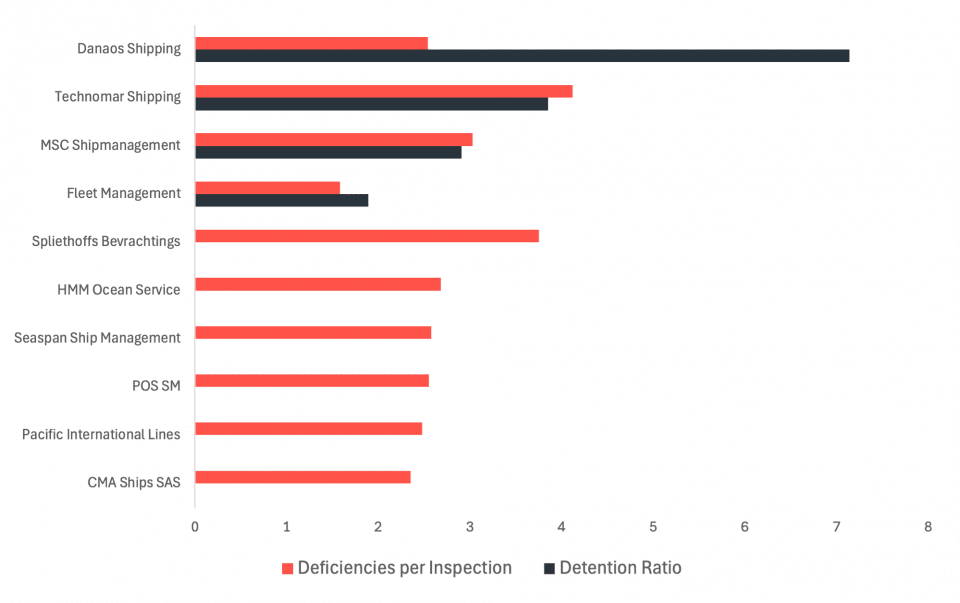 Graph 5. Top 10 worst performing ISM Managers (20+ inspections in a month) across the MOUs for July 2025- Kpler.
In July 2025, looking only at ISM managers with at least 20 PSC inspections, the worst performing cohort was defined by either non-zero detentions or elevated findings. Danaos Shipping posted the highest detention rate (7.14%) on 28 inspections with 2.54 deficiencies/inspection, while Technomar Shipping combined a 3.85% detention rate with the highest deficiency intensity in the group (4.12/inspection). MSC Shipmanagement, with the largest footprint (103 inspections), ran a 2.91% detention rate and 3.03 deficiencies/inspection, moderate percentages but material exposure in absolute terms, whereas Fleet Management showed a small 1.89% detention rate yet the lowest deficiency density (1.58). The remaining managers, Spliethoffs Bevrachtings, HMM Ocean Service, Seaspan Ship Management, POS SM, Pacific International Lines, and CMA Ships SAS, recorded 0% detentions but relatively high findings (~2.2–3.8 per inspection).

Commentaires0
Veuillez vous connecter pour lire ou ajouter un commentaire
Articles suggérés
